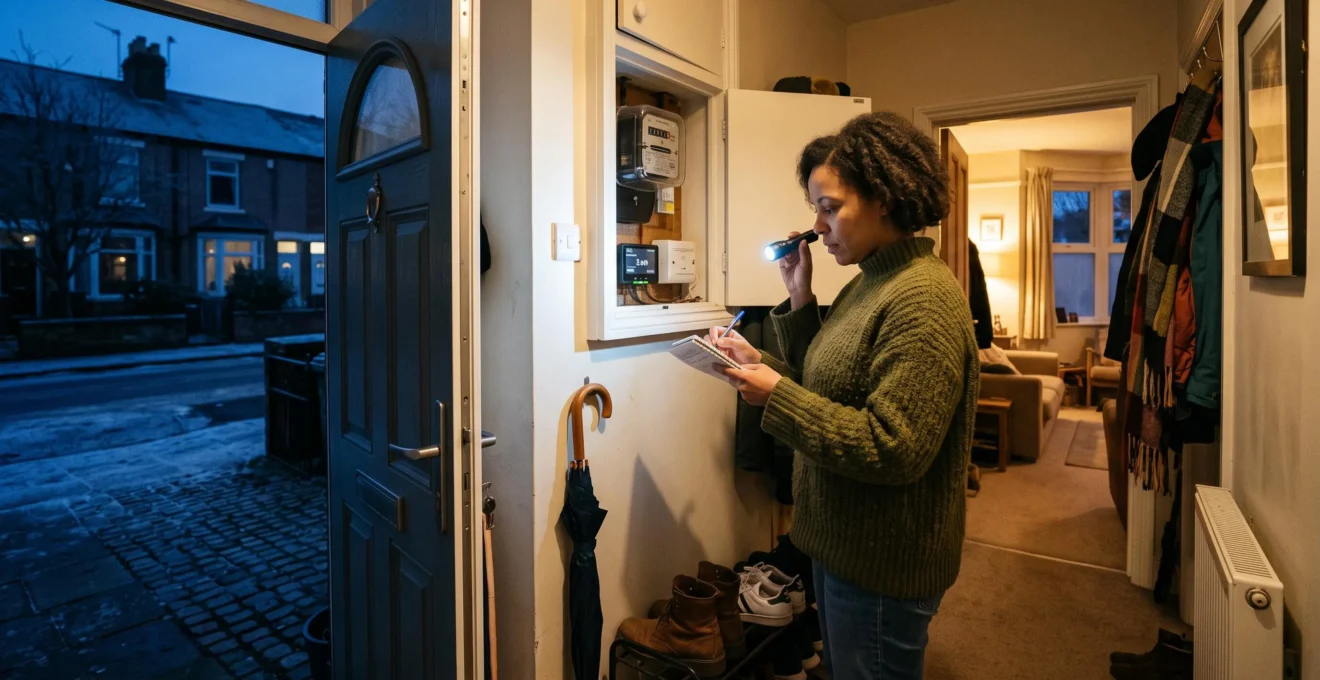
Your home’s annual energy consumption does not tell you how much heating capacity it needs on a freezing January evening. Nor does a high Energy Performance Certificate (EPC) rating necessarily mean your current system is correctly sized. Before spending thousands of pounds on a heat pump, larger boiler, insulation or home battery, you need to understand what your house actually consumes, when it consumes it and how quickly it loses heat.
Three measurements matter: total energy consumption in kilowatt-hours (kWh), peak demand in kilowatts (kW), and the amount of heating required as outdoor temperatures fall. They answer different questions. Annual consumption helps estimate running costs; heating heat-loss calculations determine equipment capacity; half-hourly electricity data helps assess battery size and tariff opportunities.
Fortunately, you do not need expensive monitoring equipment to begin. Gas bills, smart meter readings, local weather records and a few temperature observations can reveal whether your priority should be better insulation, improved heat distribution or replacement hardware. These measurements can narrow your options before a professional design survey.
What to establish before buying a winter energy upgrade
- Measure both energy consumption and peak demand. Average daily kWh cannot reliably determine the kW capacity of heating equipment or a battery inverter.
- Use seasonal gas consumption, weather data and boiler efficiency to estimate heating demand, then commission a room-by-room heat-loss calculation before selecting a heating system.
- Assess insulation, heat emitters, equipment sizing and battery settings against your measured household profile rather than generic averages or installer assumptions.
- Why Does Your “Average Usage” Hide the 2 Hours That Decide Your Heating Costs?
- How to Estimate Your Home’s Heat Demand Using Only 2 Gas Bills?
- Bigger System or Better Fabric: What Should You Choose for a Cold 2-Up-2-Down?
- The Oversizing Mistake That Adds £1,500 Upfront and Solves Nothing
- When Should You Track Energy Use for Accurate Decisions: Summer or Winter?
- EPC Rating or Energy Bills: Which One Should You Trust When They Conflict?
- How to Set Battery Charge Windows So You Cover the 5–10pm Peak Properly?
- How Do You Use a Home Battery Without Killing the Savings With Bad Settings?
Why Does Your “Average Usage” Hide the 2 Hours That Decide Your Heating Costs?
Average energy consumption conceals short periods when several household systems operate simultaneously. An evening involving heating recovery, cooking, lighting and appliance use can demand substantially more power than the daily average suggests. The distinction matters because equipment must meet the relevant peak load, while running costs depend on how much energy is consumed and the tariff charged during that period.
Consider a hypothetical household using 24 kWh of electricity in one day. Its average electrical demand is 1 kW, calculated by dividing 24 kWh by 24 hours. But suppose 10 kWh is consumed between 5pm and 7pm. During those two hours, average power demand is 5 kW, five times the daily figure.
A battery inverter restricted to 3 kW could not independently cover that sustained 5 kW electrical load, even if the battery contained sufficient energy. The household would still import electricity from the grid. Conversely, a 3 kW inverter might be entirely adequate when the true simultaneous demand is lower.
Power and energy are not interchangeable. A 5 kW load sustained for two hours uses 10 kWh. A battery with 10 kWh of usable storage could theoretically supply that energy, but only if its discharge power rating is sufficient and conversion losses are accounted for.
For heating equipment, the relevant capacity is the home’s required heat output under design conditions, not the combined electricity consumption of its kitchen and lighting circuits. Heat-pump sizing therefore requires a separate building heat-loss assessment. An undersized system may struggle to maintain comfort or rely more heavily on supplementary electrical heating, although temporary shortfalls can also arise from poor controls or inadequate radiators.
To identify your evening concentration, record an electricity meter reading at 4pm and another at 10pm on representative cold days. Subtract the readings to obtain six-hour consumption, then divide by six to calculate average demand over that window. Compare it with the day’s average kW figure. Half-hourly smart meter records provide a much clearer picture of the shorter peaks inside those six hours.
For example, 12 kWh consumed during the six-hour evening window against 24 kWh across the whole day produces a concentration ratio of 2: the evening average power is twice the daily average. The ratio describes the concentration of electricity consumption, not the house’s thermal heat loss.
Well-insulated homes with good thermal mass may experience less pronounced heating peaks because indoor temperatures fall slowly. A simple evening temperature log, taken while heating is off, helps reveal this behaviour. Record indoor and outdoor temperatures and note open windows, occupancy and other heat sources.
Once you know when energy is consumed, the next task is to separate space heating from the other energy uses hidden inside your gas bills.
How to Estimate Your Home’s Heat Demand Using Only 2 Gas Bills?
Two gas bills can provide a preliminary estimate of heating demand when their billing periods, non-heating consumption and weather conditions are understood. Compare consumption across a mild and a cold period, adjust for the heating degree days in each period, and account for boiler efficiency. The result is an approximate heating-demand indicator, not a replacement for an equipment-sizing survey.
Start with two actual meter-based bills, ideally covering comparable numbers of days. Check whether consumption is already expressed in kWh. If the bills report gas volume, use the supplier’s billed kWh conversion rather than treating cubic metres as kilowatt-hours.
- Record the gas kWh and number of days covered by each bill.
- Identify an approximate non-heating daily baseline for hot water and cooking, using a period with little or no space heating if available.
- Subtract the estimated baseline from each period’s gas consumption to isolate space-heating fuel input.
- Find heating degree days for the same dates and an appropriate local weather station, using the same base temperature throughout.
- Divide heating-attributable gas consumption by degree days to obtain an approximate gas kWh per heating degree day. Apply an appropriate boiler-efficiency assumption to estimate useful heat delivered.
A heating degree day represents how far, and for how long, outdoor temperature falls below a selected reference temperature. Because homes differ in internal gains and heating schedules, the base temperature is an analytical assumption rather than a universal thermostat setting.
Worked example: estimating heat demand from two bills
Consider a hypothetical home with two 30-day gas billing periods. The mild month records 900 kWh and 150 heating degree days; the cold month records 1,800 kWh and 350 heating degree days. Assume daily non-heating consumption is unchanged and the building’s heating behaviour is comparable.
The difference is 900 kWh over 200 additional heating degree days, giving a slope of 4.5 kWh of gas per degree day. At an illustrative seasonal boiler efficiency of 85%, useful delivered heat is approximately 3.83 kWh per degree day. If a hypothetical year accumulates 2,000 comparable degree days, that suggests about 7,650 kWh of annual space heat. These are illustrative inputs, not measured UK housing averages.
The two-period difference method works best when weather is the main factor changing between bills. If hot-water consumption, occupancy, heating hours or thermostat settings change materially, the calculated slope may be misleading. When one period genuinely contains no space heating, its daily gas consumption provides a more direct baseline estimate.
Check the result against floor area. If the hypothetical annual delivered space heat is 7,650 kWh for a 90 m² house, the result is 85 kWh/m²/year. This is an internal consistency metric, not a universal benchmark. A small insulated terrace, exposed detached house and uninsulated Victorian property may differ substantially. Construction age, floor area, exposure, ventilation and retrofit history must inform any comparison.
A heat pump delivering three units of heat for each unit of electricity would require approximately 2,550 kWh of electricity to supply 7,650 kWh of heat under that assumed seasonal performance. Performance is installation-dependent; this calculation is an energy comparison, not a heat-pump capacity recommendation.
Most importantly, annual kWh cannot establish the maximum kW needed on the coldest design day. A room-by-room heat-loss calculation must assess walls, windows, ventilation, temperatures and heat emitters. Future insulation or a higher desired indoor temperature can change the design result.
If measured heat demand is unexpectedly high, improving the building itself may deliver more lasting value than simply installing more powerful equipment.
Bigger System or Better Fabric: What Should You Choose for a Cold 2-Up-2-Down?
For a cold British two-up-two-down house, examine insulation and draughts before committing to larger heating equipment. Better fabric can reduce heat loss and make rooms more comfortable, while improved radiators and controls may allow efficient heat delivery at lower flow temperatures. The best investment depends on the property’s condition, retrofit costs and the capacity genuinely required afterwards.
A traditional two-up-two-down may have exposed solid walls, a draughty suspended floor, ageing windows or limited roof insulation. However, its construction cannot be inferred from the floor plan alone. Two houses with identical layouts may require very different heating capacities because of their exposure, construction and previous improvements.
There are three practical levers to consider, in an order that avoids unnecessary capital expenditure.
- Reduce heat loss: assess loft or roof insulation, suitable wall and floor insulation, draught-proofing and ventilation. Check moisture and condensation implications before changing the building fabric.
- Improve heat delivery: review radiator outputs, balancing, controls and design flow temperature. Better distribution may improve comfort without a larger heat source.
- Size the replacement system: use the heat-loss calculation for the building as it will exist when the new equipment is installed.
The following example demonstrates how fabric changes can influence both annual energy consumption and indicative heating capacity. Every number is hypothetical, including the assumed capacity relationship; no row should be used to size an actual property.
| Measure | Poor fabric | Average fabric | Improved fabric |
|---|---|---|---|
| Annual useful space heat | 16,000 kWh | 11,200 kWh | 7,200 kWh |
| Heat per m² annually | 200 kWh/m² | 140 kWh/m² | 90 kWh/m² |
| Illustrative design heat loss | 8 kW | 6 kW | 4 kW |
| Primary improvement question | Where is heat escaping? | Which targeted works pay off? | Can smaller equipment meet demand? |
In this illustrative comparison, moving from poor to improved fabric reduces annual useful heating energy by 8,800 kWh and design heat loss by 4 kW. The annual difference can reduce fuel consumption, subject to system efficiency, household behaviour and rebound effects. The lower design heat loss may also permit smaller heating equipment, but the price difference must be demonstrated through itemised quotations.
Comfort matters independently of fuel bills. Insulation can improve internal surface temperatures and slow overnight cooling. A larger boiler may reheat a cold room faster, but it cannot prevent that room from losing heat rapidly after the system switches off. If cold mornings are the main problem, heat retention and control schedules may be more relevant than additional peak output.
Cost, disruption and property ownership can change the preferred sequence. Solid-wall insulation may involve substantial building work, while draught-proofing and loft improvements may be comparatively straightforward. Renters normally need the relevant property owner’s permission for permanent alterations.
Funding must also be checked against current rules. Ofgem’s Great British Insulation Scheme information confirms that this programme ended on 31 March 2026. Separately, the UK government decision on extending ECO4 confirmed an extension to 31 December 2026 for England, Scotland and Wales. ECO4 support is conditional; an extension does not establish eligibility or funding for any particular household.
With the building’s likely heat loss established, the remaining risk is paying for extra capacity that offers little practical benefit.
The Oversizing Mistake That Adds £1,500 Upfront and Solves Nothing
Oversizing heating equipment can increase installation costs without solving the underlying causes of cold rooms. A hypothetical £1,500 premium might come from a larger heat pump, associated components or more extensive installation work, but it is not a standard price difference. Excessive capacity can also cause frequent cycling, reducing operating efficiency and potentially accelerating component wear.
Heating equipment should cover the calculated design heat loss under specified conditions, allowing for genuine system requirements rather than arbitrary safety margins. If a home’s design heat loss is 5 kW, selecting equipment solely because an 8 kW model appears safer may introduce a mismatch between available output and the loads experienced during most of the season.
Modern systems frequently modulate output, so the nominal maximum capacity does not tell the whole story. An oversized unit with a sufficiently low minimum output and suitable controls may operate acceptably. The concern is equipment that cannot reduce its output enough during milder weather.
When minimum output exceeds demand, the heating system may repeatedly start and stop. This short-cycling can increase losses and component activity. In heat pumps, it may also undermine the steady operation that helps achieve efficient seasonal performance. Poor hydraulic design and control settings can make cycling worse.
Oversizing occurs for several reasons. Installers may add allowances at different calculation stages, estimate capacity from old radiator ratings, or avoid the perceived risk of a complaint during extreme weather. Homeowners may request the next model size for reassurance. These choices are understandable but should be tested against a documented design.
Ask prospective installers for the room-by-room design heat loss, outdoor design temperature, selected indoor temperatures, planned flow temperature, radiator output at that temperature, and the equipment’s minimum as well as maximum output. Request an explanation of expected operation at milder outdoor temperatures and the treatment of hot-water requirements.
An itemised quotation should distinguish the main unit, hot-water cylinder where relevant, emitters, controls, electrical work and installation labour. Only then can a claimed £1,500 oversizing premium be traced to actual components rather than treated as a general rule.
If oversized equipment is already installed, replacement is not automatically the first remedy. Suitable flow-temperature adjustments, weather compensation, hydraulic balancing, control changes and fabric improvements may improve operation. Adjustments must remain within manufacturer limits and maintain safe hot-water operation.
A correctly calculated design still depends on representative measurements, which is why the season in which you collect energy data matters.
When Should You Track Energy Use for Accurate Decisions: Summer or Winter?
Track energy consumption in both summer and winter if your goal is a reliable heating upgrade decision. Summer readings help isolate hot water, cooking and other non-heating loads, while winter readings reveal how consumption changes with outdoor temperature. A complete seasonal record is more useful than a few unusually cold or mild weeks, especially when comparing equipment sizes or estimating savings.
Summer provides a reference for the energy your household consumes when space heating is largely absent. For gas-heated homes, this can help estimate domestic hot-water and cooking demand. For electricity, it establishes an appliance and occupancy baseline, although summer cooling and solar generation may affect the comparison.
Winter data adds the influence of space heating. Record gas and electricity separately because a combined financial bill cannot reliably reveal their different physical roles. If a smart meter provides half-hourly electricity readings, preserve the intervals as well as the monthly totals; short-duration peaks may disappear in monthly summaries.
The UK heating season should be defined by actual heating operation and weather rather than fixed dates. One household may begin heating earlier than another because of insulation, occupancy or preferred indoor temperatures. Note when space heating starts and stops and, where practical, record daily outdoor temperature alongside energy consumption.
A full heating season gives a stronger basis for calculating weather-normalised demand. Ideally, compare it with a non-heating baseline and use representative local heating degree days to adjust for differences between a measured season and a typical one. Where historical supplier readings exist, they may shorten the period needed to establish an initial estimate.
Three weeks of autumn readings can reveal usage behaviour, but they are rarely enough to establish design heat loss. A mild October period may underrepresent winter heating needs; a brief cold snap may overstate annual energy consumption if extrapolated without weather adjustment.
Five measurements to complete before requesting an installation quote
- Download or photograph twelve months of gas and electricity readings. Deliverable: a dated consumption table in kWh for each fuel.
- Identify a low-heating period and calculate average daily baseline consumption. Deliverable: a baseline kWh/day figure with the dates used.
- Record cold-evening electricity use, preferably in half-hour intervals. Deliverable: an evening load profile showing both kWh and average kW by interval.
- Match heating-period consumption with local degree-day records and document your assumptions. Deliverable: an estimated space-heating kWh per degree day and its limitations.
- Record desired room temperatures and request a room-by-room heat-loss assessment. Deliverable: a written design heat-loss calculation against which quotations can be compared.
If a purchase is urgent and a complete season is unavailable, use historic meter data where possible, state the uncertainty and obtain a properly documented survey. The absence of a full year’s personal monitoring does not justify guessing at heating capacity.
Once actual consumption is documented, compare it with the home’s EPC to understand why a standardised building assessment may describe a different energy profile.
EPC Rating or Energy Bills: Which One Should You Trust When They Conflict?
Trust EPC information for a standardised assessment of a property’s energy performance, but use measured consumption to understand your household’s actual energy use. Neither source independently determines the correct heating-system capacity. When the two disagree, investigate occupancy, heating habits, survey assumptions and changes to the building before choosing new equipment.
An Energy Performance Certificate assesses a building through a standard methodology, accounting for its fabric, heating systems and energy-related characteristics under defined assumptions. The resulting rating helps compare properties and serves specific regulatory and transaction purposes. It is not a live measurement of household energy use.
The UK government guidance on domestic Energy Performance Certificates explains the role of standard occupancy assumptions. These assumptions cannot reflect every family’s temperature preferences, working patterns, hot-water consumption or appliance use.
Consider two otherwise identical homes. One household heats all rooms for long periods and maintains relatively high temperatures. Another heats fewer rooms and accepts cooler conditions. Their bills can differ considerably even when their EPC assessments are similar.
Likewise, a home’s actual consumption may be lower than its EPC estimate because improvements were installed after the assessment, occupancy is lower than assumed, or the household accepts cooler temperatures. A lower bill does not by itself prove the building has a lower design heat loss.
Start reconciliation by estimating annual useful space heat from meter readings and comparing it with the relevant EPC energy-use figures on a consistent basis. Check whether the EPC refers to modelled delivered energy, costs or another metric, and whether it includes hot water and lighting. Do not compare these figures directly without aligning scope and units.
Normalising estimated useful space heat by floor area produces kWh/m²/year. This is helpful for comparing the same building over time, but comparisons with the EPC must also allow for efficiency, weather and household behaviour.
Next, inspect the certificate’s assessment date and recommendations. Look for insulation, glazing, heating-system or ventilation changes made afterwards. Confirm that the recorded building characteristics match the property. The EPC’s improvement recommendations can inform an investigation, but they are not a substitute for measured savings estimates or itemised retrofit quotations.
For selling, letting, compliance and applicable support schemes, follow the relevant EPC requirements. For budgeting and understanding current consumption, rely on measured bills. For a new heat pump or boiler, require a design heat-loss calculation consistent with intended indoor temperatures and planned building improvements.
That same distinction between a standard estimate and a real household demand profile becomes especially important when configuring electricity storage.
How to Set Battery Charge Windows So You Cover the 5–10pm Peak Properly?
To cover a 5pm–10pm evening peak, calculate how much electricity your household actually uses during those hours, then schedule the battery to hold sufficient usable energy before the expensive period begins. Its charge rate, discharge power limit, storage capacity and tariff hours must all be considered. The cheapest configuration depends on your specific tariff, solar generation and household demand.
First, inspect half-hourly electricity readings for representative weekdays and weekends. Calculate total consumption between 5pm and 10pm, but also identify the highest simultaneous demand. A battery’s usable storage capacity is measured in kWh, while its inverter’s power limit is expressed in kW.
Suppose a hypothetical household uses 8 kWh between 5pm and 10pm and wants its battery to cover that demand. If the system loses 10% of the stored energy during discharge and conversion, it would need approximately 8.9 kWh of stored usable energy at the start of the period, assuming no solar contribution and a compatible discharge power limit. The loss assumption is illustrative, not a product specification.
The charge window must supply that stored energy before the relevant peak tariff begins. With a hypothetical 3 kW sustained charging rate, replenishing 9 kWh would require at least three hours in an idealised no-loss calculation. In practice, charging efficiency, tapering, reserve settings and system limits may increase the time required.
Next, consult your own electricity tariff. Economy 7 provides an off-peak period, but its exact hours depend on the applicable arrangement and meter setup. Time-of-use tariffs can have different cheap, intermediate and expensive periods. A 5pm–10pm window is a useful example for assessing evening demand, not a universal UK peak-pricing rule.
Configure eligible grid charging during genuinely cheaper periods, where supported by the inverter and tariff. Arrange the discharge strategy so stored electricity is available during expensive hours. Check that reserve settings do not make an unexpected portion of nominal battery capacity unavailable.
Solar generation complicates the calculation. In summer, panels may fill the battery before the evening, making overnight grid charging unnecessary or financially unattractive. In winter, generation may be insufficient, so overnight charging can be more valuable when the tariff spread supports it.
After a week, compare the battery’s state of charge with half-hourly imports between 5pm and 10pm. If imports rise while the battery still holds substantial energy, inspect discharge limits and control settings. If it empties early, investigate actual consumption, reserved capacity and charging completeness before concluding that more hardware is needed.
Correct charge windows solve only part of the problem. The chosen operating mode, export arrangements and regular settings reviews determine whether the battery produces financial savings.
Key takeaways before deciding on a home battery
- A battery can shift electricity purchases between tariff periods, but it does not reduce the home’s underlying heating heat loss.
- Usable kWh determines how much electricity can be stored; inverter kW determines how much power can be supplied at once.
- Compare avoided import costs, charging costs, round-trip losses and forgone export revenue before treating battery savings as a return on investment.
How Do You Use a Home Battery Without Killing the Savings With Bad Settings?
A home battery saves money only when its operating strategy matches your electricity consumption, tariff and generation profile. Incorrect charge schedules, unnecessary cycling, excessive reserves and overlooked export revenue can reduce or eliminate the expected benefit. The best starting point is your measured half-hourly demand, followed by a financial comparison of self-consumption and time-of-use charging.
The key question is not simply whether a battery can power your home in the evening. It is whether storing and later using electricity costs less than purchasing that electricity directly, after accounting for losses, battery costs and alternative uses of solar generation.
For grid-charged storage, compare the cost of charging against the import price you would otherwise pay. In a hypothetical example, electricity purchased for 10p/kWh with a 90% round-trip efficiency has an effective energy purchase cost of approximately 11.1p per kWh delivered, before any allowance for storage wear or capital cost. If the avoided import rate is 30p/kWh, the gross energy-price difference is approximately 18.9p per delivered kWh.
These are example rates, not current UK tariff quotations. The actual benefit depends on your contract, charging constraints and the electricity that would otherwise have been imported.
Solar storage involves a different opportunity cost. If exported solar electricity earns a payment, using that energy in the home sacrifices the export revenue. Storing one solar-generated kWh also means that less than one kWh will normally be available for later consumption because of conversion and storage losses.
Two operating strategies are commonly worth comparing.
| Decision factor | Solar self-consumption | Time-of-use arbitrage |
|---|---|---|
| Main objective | Use more electricity generated on site | Shift electricity imports from expensive to cheaper periods |
| Charging preference | Available solar surplus | Eligible off-peak grid electricity |
| Important financial variable | Value of avoided imports versus forgone exports | Peak/off-peak price difference after losses |
| Typical operating risk | Storing electricity that could earn a better export return | Charging during expensive periods or discharging too early |
| Adjustment needed | Review solar surplus and seasonal demand | Review tariff times, rates and evening demand |
A household with both solar panels and a variable tariff may benefit from combining strategies, subject to equipment capabilities and tariff rules. A configuration appropriate in June may be inefficient in December.
Research by the Energy Saving Trust reinforces the importance of those differences. Its research on home technologies and time-of-use tariffs, published in July 2026 and based on 2024 energy-price assumptions, examined more than one million modelled scenarios involving household characteristics, heat pumps, solar panels, batteries and tariffs.
More than 1 million modelled scenarios
The Energy Saving Trust research examined technology and tariff combinations. Its findings indicate that tariff choice materially affects financial outcomes and that a battery does not necessarily recover its upfront cost within its expected lifetime. These are modelled results, not guaranteed savings for an individual home.
Energy Saving Trust, July 2026; model assumptions included 2024 energy prices.
Several configuration errors deserve attention: charging from the grid during expensive periods without a clear reason, discharging stored energy unnecessarily before the tariff peak, keeping an excessive reserve, ignoring standby consumption, or failing to account for solar export payments. Some systems also have charging or discharge restrictions that depend on the manufacturer’s controls and installation configuration.
Use the first three months after installation as a calibration period. Compare smart meter imports, exports, battery charging, discharging and state of charge against the household’s previous profile where comparable data exists. Separate the effects of changing weather, tariffs and occupancy rather than attributing every bill movement to the battery.
Then review settings whenever the tariff changes, solar generation shifts seasonally or household routines change. A battery that covers evening demand effectively may still be uneconomic if the achieved savings are too small relative to its installed cost.
Build a simple comparison of annual usable energy shifted, avoided import costs, charging costs, lost export revenue and installation price. Use it to test the purchase against realistic alternatives, including fabric improvements and heating-system optimisation. Measure first, specify second, and review actual performance after installation.
Can I size a heat pump using my annual gas consumption?
Annual gas consumption can help estimate useful heating energy once non-heating uses and boiler efficiency are considered. It cannot independently establish the kW of heat needed during design winter conditions. A room-by-room heat-loss calculation, incorporating the intended indoor temperatures and planned fabric improvements, is required to determine suitable heat-pump capacity.
Do I need a smart meter to measure winter energy demand?
No. Manual gas and electricity meter readings can establish daily consumption, seasonal patterns and approximate evening usage. A smart meter with accessible half-hourly data makes it easier to identify electricity peaks and assess battery operation. Neither type of meter directly measures the building’s thermal heat loss.
What if my home is already cold despite high energy bills?
High consumption alongside poor comfort may indicate excessive fabric heat loss, draughts, inadequate heat emitters, control problems or heating equipment that cannot deliver sufficient output. Record room temperatures, heating operation and consumption, then investigate the building and system together. Purchasing a larger heat source without identifying the cause may not solve the problem.
Can I make reliable upgrade decisions without a full year of measurements?
Yes, with appropriate limits. Historic supplier records, available winter bills, degree-day analysis and a professional survey can provide a useful starting point. A shorter monitoring period leaves greater uncertainty about seasonal demand and atypical weather. Document that uncertainty rather than extrapolating a short snapshot as though it represented a full year.
Does reducing my winter electricity peak automatically make a home battery worthwhile?
No. Reducing expensive-period imports can save money, but the investment must also account for storage losses, charging costs, available tariffs, export revenue, installation cost and expected usable lifetime. A favourable operating saving does not necessarily establish an attractive overall financial return.