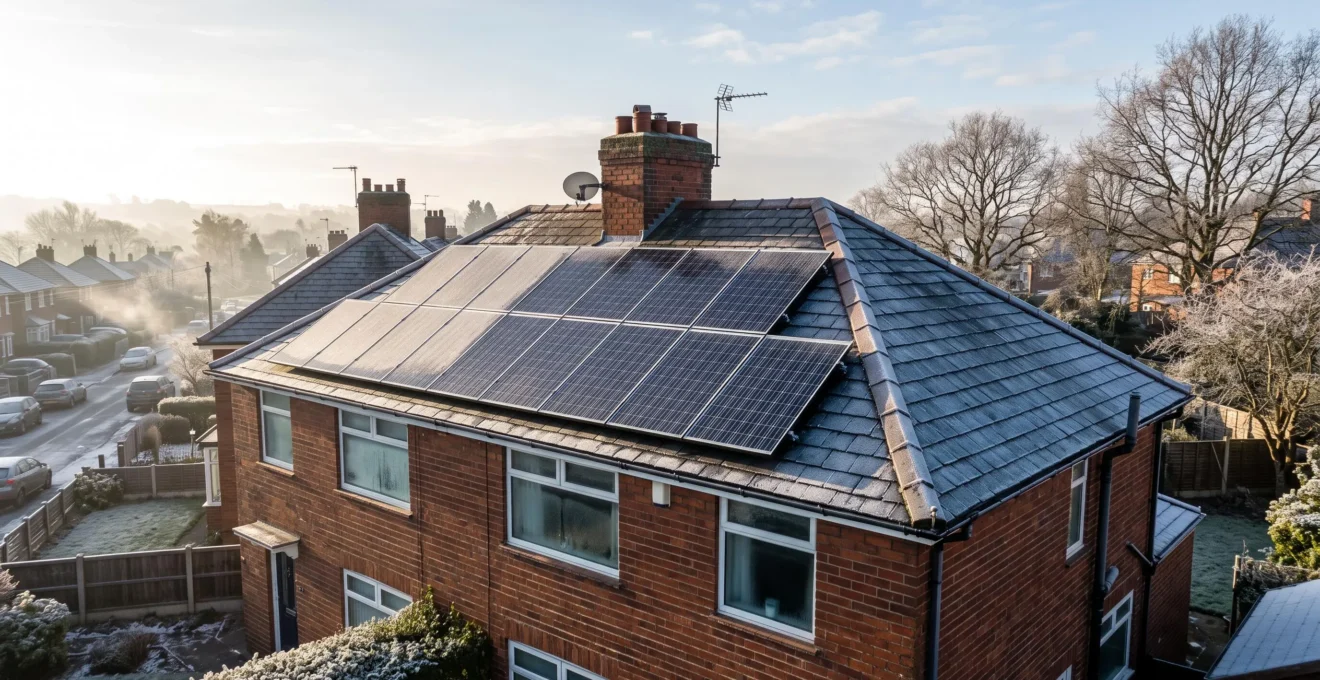
It’s a clear January morning in Britain. The sky is brilliant blue, sunlight is pouring through the windows, and your solar monitoring app shows disappointingly little electricity being generated. On an equally sunny summer day, the same panels seemed to produce far more. Is something wrong?
Usually, no. Bright skies do not necessarily mean strong solar energy. During a British winter, the sun stays low, daylight hours are limited, and its rays reach rooftop panels at less favourable angles. Even when conditions look exceptionally sunny, the total energy available to your installation can be much lower than in summer.
The cold itself is not the main problem. Photovoltaic cells generally perform more efficiently at lower temperatures when other conditions are equal. What matters more is how much usable solar radiation actually reaches their surfaces.
Understanding that difference makes monitoring data easier to interpret. It also helps you distinguish ordinary seasonal performance from genuine faults, avoid unnecessary maintenance costs, and make better decisions about shading, cleaning and household electricity use.
Why bright winter days can mean low solar output
- Sunlight intensity matters more than visual brightness. The low winter sun, short days and changing cloud cover reduce the energy reaching UK rooftops.
- Low output does not automatically mean a fault. Compare monitoring data with realistic weather and seasonal expectations before calling an installer.
- Your roof matters more than your neighbour’s figures. Orientation, shading, installation design and local conditions can create substantial differences in generation.
- Why Does Winter Sun Look Bright but Deliver Less Usable Energy?
- How to Tell if a Midday Solar Drop Is Normal or a Fault in 10 Minutes?
- Cloudy Skies vs Short Days: Which Cuts UK Solar Output More in Practice?
- The Monitoring Misread That Triggers a £150 Callout for No Reason
- When Should You Check or Clean Solar Panels if You Live Near Trees or Seagulls?
- Why Can Two UK Homes 2 Miles Apart Get 2x Different Solar Output?
- Cloudy Skies vs Short Days: How to Judge Which One Is Costing You More?
- Are Solar Panels Worth It on a UK Roof That Gets Sun Only After 11am?
Why Does Winter Sun Look Bright but Deliver Less Usable Energy?
Winter sunlight can look dazzling while delivering relatively little usable energy because human eyes judge brightness differently from solar panels. In the UK, the winter sun remains low in the sky, daylight lasts fewer hours, and the available radiation is often weaker. Cold temperatures can improve photovoltaic efficiency, but they cannot replace missing sunlight.
The key distinction is between perceived brightness and solar irradiance. Your eyes adapt to changing light levels, making a clear winter sky appear exceptionally bright. Photovoltaic panels, however, respond to the solar energy reaching their surfaces, not to how bright the scene looks to you.
Solar radiation reaches panels through two main pathways:
- Direct radiation: Sunlight travelling directly from the solar disc to the panel.
- Diffuse radiation: Sunlight scattered by the atmosphere, haze and clouds before reaching the surface.
The European Commission‘s PVGIS 5 user manual explains these radiation components and how they contribute to solar-energy calculations.
In winter, the sun’s lower position changes how directly its rays strike your roof. When light arrives at a shallow angle to the panel surface, less power is available per unit of panel area, and reflection losses can increase. The exact effect depends on the roof’s orientation and pitch: a suitably tilted south-facing array can capture winter sunlight more effectively than a flat or poorly oriented installation.
There is also a simple time constraint. A British summer day provides a much longer generation window than a winter day. More daylight does not translate into proportionally more electricity, because early morning and late evening sunlight is relatively weak, but it still gives panels considerably more opportunity to generate.
Cold photovoltaic cells generally experience lower temperature-related electrical losses than hot cells. This can make a crisp, sunny day perform better than an equally irradiated hot day. It does not mean that a clear December day should match a clear June day.
Snow, frost, and persistent surface moisture can introduce additional short-term effects. Snow physically covering modules blocks incoming radiation, while frost or condensation may temporarily scatter or obstruct light. These effects depend on how much of the panel is affected and how quickly the covering clears.
A useful seasonal comparison is therefore based on your installation rather than a universal winter-output percentage.
| Period | Typical expectation | Best comparison |
|---|---|---|
| Winter | Low daily energy totals, with short and sometimes sharply peaked production curves | Comparable clear days in the same winter period |
| Spring | Rising daily totals as available daylight and solar elevation increase | Previous spring records and location-specific estimates |
| Summer | Greater opportunity for high daily energy production | Comparable summer days, allowing for weather and temperature |
| Autumn | Declining daylight and output, with potentially greater shading from nearby vegetation | Previous autumn records and changes in shading |
For numerical expectations, use the European Commission’s PVGIS grid-connected solar calculation documentation to understand how monthly and annual estimates are calculated. A model tailored to your location, installed capacity, orientation, tilt and assumed losses provides a defensible comparison. There is no single winter-to-summer production ratio that fits every UK roof.
The practical lesson is to judge winter generation against realistic winter conditions, not against your strongest summer day. Once that baseline is clear, an unexpected dip is much easier to investigate.
How to Tell if a Midday Solar Drop Is Normal or a Fault in 10 Minutes?
A midday solar-output drop is often normal if a cloud passes, a nearby object casts a temporary shadow, or the monitoring app updates late. A genuine problem becomes more plausible when generation falls sharply and stays abnormally low under stable conditions, particularly if the inverter reports an error. A short, systematic check can help distinguish the two.
Start by looking at the shape of the generation curve. Passing clouds can produce sudden dips followed by rapid recoveries. A chimney, tree or neighbouring building may create a similar pattern at approximately the same time on successive days.
Next, compare the current reading with a solar forecast for your location. A general weather forecast saying “sunny” is not enough: cloud thickness, haze and the timing of sunshine affect the radiation reaching the roof.
A solar-production forecast can provide context, but it is still an estimate. Models may not capture your chimney, a neighbour’s roof extension or a newly overhanging branch.
Two inverter behaviours also deserve attention. Clipping occurs when the available DC power exceeds the inverter’s conversion capacity, producing a flat-topped output curve instead of an ever-rising peak. This is not the same as a sudden unexplained shutdown.
At the other end of the scale, an inverter needs sufficient input from the panels to operate. When available sunlight is very weak, it may remain in standby or stop converting electricity until operating conditions recover.
| Monitoring pattern | Possible explanation | Appropriate response |
|---|---|---|
| Brief dip followed by recovery | Passing cloud or temporary shadow | Compare with weather and repeat observations |
| Flat peak during strong sunlight | Possible inverter clipping | Check inverter rating and installation design |
| Repeated dip at the same time | Fixed or seasonal obstruction | Observe the roof’s shading pattern |
| Zero production despite good sustained sunlight | Potential inverter, electrical or monitoring issue | Check status messages and contact support if unresolved |
| Persistent mismatch between comparable strings | Different shading, configuration or possible component issue | Confirm like-for-like conditions and request diagnosis |
Your 10-minute solar-output diagnostic checklist
- Capture the reading. Save a screenshot showing the current power, daily energy total and exact observation time.
- Check the conditions. Record whether the sky is clear, changing or overcast, and save a local weather or solar-forecast reference.
- Look for shadows. Observe the roof safely from ground level and note any chimney, tree or building shadow affecting the array.
- Read the inverter status. Record any visible warning, error code or standby indication without opening equipment or touching electrical connections.
- Compare and document. Save a comparable previous-day graph or forecast and write a brief description of whether the drop recovered or persisted.
If the problem remains unexplained, contact your installer with those records. Never open an inverter enclosure or attempt electrical repairs yourself. Checking monitoring information is appropriate for a homeowner; diagnosing internal electrical faults is a job for a competent professional.
A useful diagnosis is based on the timing, conditions and persistence of the problem. That matters because two apparently similar low-output days can have very different causes.
Cloudy Skies vs Short Days: Which Cuts UK Solar Output More in Practice?
Both cloudy skies and short days reduce UK solar generation, but they act differently. Short winter days restrict the available production window, while clouds reduce the intensity of sunlight reaching panels during that window. Neither factor universally dominates: the answer depends on the location, season, weather and installation. Their combined effect explains much of the seasonal variation households observe.
Consider day length first. In winter, the sun rises later and sets earlier, leaving fewer hours during which an array can produce electricity. Its lower position also changes the intensity and angle of incoming radiation.
The lost early-morning and late-afternoon hours are generally less productive than midday hours, so generation does not fall in direct proportion to daylight duration. Nevertheless, fewer daylight hours place a structural limit on the day’s total output.
Cloud cover acts differently. Clouds scatter and absorb parts of the incoming sunlight, changing how much direct and diffuse radiation reaches the array.
Solar panels can generate electricity under cloud cover because diffuse radiation still reaches them. However, heavy cloud can substantially reduce available irradiance, including around midday when generation could otherwise be strongest.
The distinction is easier to visualise by separating time from intensity.
| Factor | Shorter daylight | Cloud cover |
|---|---|---|
| Main mechanism | Reduces the time available for generation | Changes the radiation reaching panels during daylight |
| Predictability | Highly predictable from date and location | Variable across hours, days and seasons |
| Midday influence | Does not inherently remove midday sunlight | Can strongly suppress midday generation |
| Monitoring signature | Shorter overall daily production window | Reduced or irregular output within that window |
| Household response | Plan around seasonal generation | Adapt electricity use to short-term forecasts |
On a clear winter day, the limited daylight window is especially visible. On a heavily overcast day, clouds may suppress production throughout the available window. Comparing those conditions is more informative than debating which factor is always worse.
This also explains why Britain’s cloudy climate does not automatically make solar panels ineffective. Annual generation depends on cumulative solar energy across the year, not on whether every day looks sunny. A weak December cannot represent the entire installation’s annual performance.
The more reliable benchmark is a location-specific annual and monthly production estimate compared against measured generation over a meaningful period.
Once those two effects are separated conceptually, the next challenge is reading the monitoring app correctly. A misleading number can make an ordinary winter day appear much worse than it really is.
The Monitoring Misread That Triggers a £150 Callout for No Reason
One of the easiest solar-monitoring mistakes is confusing instantaneous power, measured in kilowatts (kW), with accumulated electricity generation, measured in kilowatt-hours (kWh). A low power reading at a particular moment does not mean the whole day’s generation is poor. Misreading that distinction can lead to an unnecessary installer visit, potentially costing money if the visit is chargeable.
The £150 in this heading is an illustrative callout amount, not a verified standard UK fee. Actual charges depend on the installer, travel requirements, service arrangements and warranty terms. Some checks may be covered, while others may be billed.
Understanding the two main measurements helps prevent confusion:
- Power (kW): How quickly the system is generating electricity at a particular moment.
- Energy (kWh): How much electricity has been generated across a period, such as a day or month.
For a hypothetical example, an array producing 1 kW steadily for one hour generates 1 kWh of electricity. If production fluctuates, the energy total depends on the power delivered throughout the period, not on any one screenshot.
This is why an app displaying a low instantaneous reading late in the afternoon may still show a perfectly reasonable daily total.
Other display settings create similar confusion. Some monitoring apps use automatically changing graph scales. A curve that looks much smaller than yesterday’s may reflect a different vertical axis rather than a comparable drop in physical output.
Monitoring systems may also report delayed or aggregated readings rather than truly instantaneous values. Some interfaces display individual strings, module groups or inverter readings separately. Comparing one subsystem with yesterday’s whole-system total produces a misleading result.
Finally, a zero reading is not automatically evidence of failure. Inverters can enter standby during periods of insufficient sunlight. Early mornings, late evenings and very dark weather can therefore produce zero or near-zero readings without any malfunction.
Before booking a visit, keep screenshots from more than one day, note the weather, compare total daily energy rather than isolated power values, and check whether new shading could explain the difference.
Check accessible breaker status indicators only where your equipment instructions permit it. Do not remove covers, reset protective devices repeatedly or interfere with wiring. If there is an electrical warning or evidence of damage, seek professional advice rather than continuing checks.
Read your warranty and servicing terms before authorising a paid appointment. A brief remote conversation supported by clear evidence may resolve a misunderstanding without a site visit, although persistent faults still warrant professional attention.
When the figures are genuinely lower than expected across comparable conditions, the next question is whether the panels themselves are receiving less light than before.
When Should You Check or Clean Solar Panels if You Live Near Trees or Seagulls?
Solar panels near trees or seagull activity should be inspected when visible deposits, new shading or a persistent unexplained reduction in generation suggests a problem. A rigid cleaning schedule is often unnecessary because rainfall removes much ordinary dust. Localised bird droppings, leaves, moss or tree residue, however, may justify more targeted attention.
The useful distinction is between general dirt and persistent, concentrated soiling. A thin layer of ordinary dust may have a different effect from a patch of opaque bird droppings covering part of a cell or module.
Because solar cells are electrically connected within a module, localised obstruction can affect current flow beyond the precise area covered. Bypass diodes and module architecture influence the size of that effect, so a dirty patch does not translate into a simple percentage loss based on its visible area.
For homes beside deciduous trees, autumn can bring leaves into roof valleys and module edges. Nearby branches may also produce shadows that move or intensify as the sun’s seasonal position changes.
Coastal installations can face repeated bird fouling. Gulls may also nest around rooftops in spring, creating practical maintenance difficulties and potential wildlife-protection considerations. Any active nest should be left undisturbed pending appropriate professional guidance.
After a wet winter, moss or accumulated organic material may become more noticeable around frames and roof fixtures. Not every visible deposit requires cleaning, but persistent concentrations deserve investigation if they coincide with reduced generation.
A more useful maintenance approach is to compare generation trends with photographs taken from a safe position. If the same array gradually underperforms in otherwise comparable conditions, look for new shading, deposits or changes in equipment status.
A one-sided change in a daily generation curve may suggest morning or afternoon shading. It is not, by itself, proof of dirt: clouds, seasonal solar position and system behaviour can produce similar patterns.
Where soiling is clearly visible and persistent, ask whether professional cleaning is appropriate. Roof access presents significant fall risks, and panels can be difficult to reach without specialist equipment.
For homeowners, the safest default is a ground-level visual assessment or photography from a secure position. Avoid climbing onto roofs or using a ladder to reach the array. A qualified service provider can assess access and cleaning requirements.
Cleaning methods should also follow the module manufacturer’s instructions. Abrasive materials, unsuitable chemicals and excessive pressure may damage surfaces or components. Check installation and product warranty conditions before arranging work.
Photographs taken at comparable intervals can also reveal vegetation that has grown into the panels’ sunlight path. If trimming is necessary, assess the tree’s condition, ownership and any applicable restrictions before arranging work.
Even well-maintained panels can produce very different amounts of electricity from those on a nearby roof. That is because cleanliness is only one part of the installation’s individual performance.
Why Can Two UK Homes 2 Miles Apart Get 2x Different Solar Output?
Two homes just two miles apart can show substantially different solar generation because distance alone says little about their installations. Roof orientation, pitch, shading, installed capacity, inverter configuration and local weather all matter. A twofold difference can occur in particular circumstances, but it does not automatically indicate that either system is faulty.
First, compare like with like. An installation with a larger panel capacity can naturally generate more total electricity than a smaller one. Raw kWh figures are therefore a poor way to judge relative performance.
A fairer starting point is electricity generated per installed kilowatt-peak (kWh/kWp) over the same period. This accounts for system size, although it does not remove differences in orientation, shading and equipment design.
Consider two hypothetical homes with equal installed capacity. One has a reasonably unobstructed south-facing roof. The other faces a different direction and receives a prolonged shadow from a neighbouring tree. Their daily production curves may differ considerably even though both installations function correctly.
Microclimates can add another layer of variation. Coastal cloud, local mist, valley conditions and urban shading may produce different sunlight conditions over relatively short distances.
Equipment configuration matters too. Two installations may differ in panel technology, age, inverter efficiency, wiring arrangements and the way shaded modules are managed. A single string serving panels with mixed orientations may behave differently from a design using separate strings or module-level electronics.
There is no reason to assume every nearby system should have identical output or that a particular difference must arise from one specific component.
Use the following comparison to identify the most plausible causes.
| Variable | What to check | Why it matters |
|---|---|---|
| Installed capacity | Total panel rating in kWp | Different system sizes produce different raw kWh totals |
| Roof orientation and pitch | Direction faced and module tilt | Changes the timing and amount of solar radiation received |
| Shading | Trees, chimneys and buildings at different hours | Can suppress generation during specific periods |
| Module condition | Age, visible dirt and obstruction | May affect energy conversion or available illumination |
| Electrical configuration | Inverter type, strings and panel grouping | Influences how the system responds to differing conditions |
| Measurement period | Matching dates, times and data completeness | Prevents misleading comparisons between different observation windows |
National annual-generation averages cannot fully represent such rooftop differences. They are useful for broad expectations, but less useful for explaining the performance of a particular shaded installation.
A better approach is to model each roof separately using its actual configuration, then compare each system’s measured production with its own estimate.
The most useful comparison is not between two unrelated daily totals, but between what each installation should reasonably produce and what it actually generates. The same principle helps identify the relative effects of clouds and short daylight.
Cloudy Skies vs Short Days: How to Judge Which One Is Costing You More?
To estimate whether clouds or short daylight are affecting your solar generation more, compare your own monitoring records under controlled conditions. Days close together in the calendar can reveal cloud-related differences when daylight duration is similar. Comparing clear days across seasons helps illustrate changes associated with daylight and solar position. Neither comparison perfectly isolates one variable, but both improve on guesswork.
The simplest starting point is to export daily generation totals from your monitoring app, where that feature is available. Record the date, daily kWh, approximate weather conditions and any significant shading or equipment problems.
Then compare days within the same short period. Because their daylight duration and solar geometry are similar, differences in cloud cover can be a major explanation for different energy totals, provided other conditions are reasonably comparable.
For example, in an explicitly hypothetical comparison, two winter days might have nearly identical daylight duration. If one is mostly clear and the other heavily overcast, the difference between their measured production totals provides an indication of the effect of prevailing weather.
That difference is not necessarily an exact cloud-loss measurement. Temperature, haze, shading and other conditions may also have changed.
To investigate seasonal limitations, compare relatively clear days from different times of year. Look at both the number of productive hours and the output curve around midday.
A clear summer day will generally offer a longer generation window and different solar geometry from a clear winter day. That comparison demonstrates the broader seasonal effect, but it does not isolate day length from solar elevation.
For a more structured assessment, the PVGIS monthly solar radiation documentation explains the available irradiation variables, including global irradiation, direct radiation and the diffuse fraction.
These monthly radiation estimates can help explain how the solar resource changes through the year. They are not direct measurements of an individual household’s electricity generation.
A practical interpretation is to separate what households can plan around from what they must adapt to.
- Short winter days: Predictable seasonal constraints that help inform electricity-use and storage planning.
- Cloud variability: Less predictable reductions that make short-term forecasts and flexible household demand useful.
- Roof shading: Site-specific constraints that may require a separate assessment rather than being attributed to weather.
Do not make a major investment decision from an unusually cloudy month alone. Solar financial performance should be assessed using expected annual generation, consumption patterns and the range of plausible outcomes rather than treating one poor spell as representative.
Once your records distinguish predictable seasonal limits from variable weather, you can assess an even more practical question: whether a roof that receives direct sun only later in the day can still justify solar panels.
Key takeaways before assessing a shaded roof
- A morning shadow reduces potential generation, but its annual impact depends on when it occurs and how the roof is oriented.
- Electricity produced when the household can use it may be more valuable than an identical amount generated when demand is low, depending on tariff arrangements.
- Compare modelled annual production and realistic household savings before deciding whether panels, storage or demand shifting make financial sense.
Are Solar Panels Worth It on a UK Roof That Gets Sun Only After 11am?
Solar panels can still be worthwhile on a UK roof that receives direct sunshine only after 11am, but the answer depends on annual generation and household electricity use. Morning shading reduces potential production, yet afternoon generation can remain valuable. A proper assessment must account for the roof’s orientation, seasonal shadows, electricity prices and installation costs.
The first question is why direct sunshine starts at 11am. An east-side obstruction, nearby building or group of trees can create morning shading even on an otherwise well-oriented roof.
An inherently west-facing roof also tends to receive more favourable direct sunlight later in the day than in the morning. These circumstances should not be treated as identical.
A west-facing array can generate electricity at times that align well with afternoon and early-evening household consumption. However, its annual generation and economic performance still depend on the particular roof and demand profile.
Afternoon light may be strong, but that does not mean panels benefit from heat. Higher cell temperatures can reduce electrical efficiency. The potential advantage of afternoon generation is primarily its available sunlight and timing relative to demand, not warmer modules.
Before committing to an installation, examine the shading pattern at several relevant times and dates. A roof that receives direct sun by 11am in summer might remain shaded substantially longer during winter because the sun follows a lower path across the sky.
The period around the winter solstice is particularly informative for understanding the most restrictive winter shading conditions. It should be considered alongside spring, summer and autumn observations, not used as the sole predictor of annual performance.
A practical assessment should include:
- Document the roof’s direction, pitch and installed or proposed panel capacity.
- Observe the timing and extent of shadows across different seasons from a safe viewpoint.
- Obtain a location-specific production estimate using realistic shading assumptions.
- Compare likely generation hours with household electricity demand, particularly afternoon and evening consumption.
- Evaluate installation costs, self-consumption, export arrangements and any proposed battery storage using realistic assumptions.
Battery storage may increase the proportion of solar electricity used later, but it introduces additional cost and storage losses. Its financial value should be calculated rather than assumed.
Similarly, shifting flexible household loads into productive afternoon periods may improve self-consumption without requiring a battery. The appropriate approach depends on when electricity is needed and how it is priced.
For a financial decision, a useful scenario compares the expected annual electricity value of the shaded installation with its installed cost and ongoing expenses. Uncertainty should be reflected in the assumptions, especially where shading is difficult to model.
A weak winter week does not establish that a shaded roof is uneconomic. Equally, a productive summer afternoon does not establish that an installation will deliver attractive annual savings.
The next useful action is to gather your roof’s shading observations, electricity-use pattern and estimated annual production, then compare realistic installation options. A decision based on the full year will be far more informative than one based on a sunny afternoon or a disappointing January monitoring screenshot.
Can solar panels produce electricity when there is no direct sunshine?
Yes. Photovoltaic panels can convert diffuse sunlight scattered by clouds and the atmosphere into electricity. However, the available energy may be much lower under thick cloud than under clear skies. Actual output depends on the irradiance reaching the modules and the system’s operating conditions.
Does a freezing temperature mean solar panels are performing badly?
No. Lower cell temperatures can improve photovoltaic conversion efficiency when sunlight and other conditions are comparable. The main winter limitations are reduced available solar radiation, shorter daylight and seasonal shading. Frost or snow covering the modules may create additional temporary losses.
Should a UK solar system generate its rated kWp in winter sunshine?
Not necessarily. A system’s rated kilowatt-peak capacity describes performance under specified standard test conditions, not a guaranteed output whenever the sky is clear. Actual instantaneous power depends on irradiance, cell temperature, orientation, shading and equipment limitations. Daily kWh generation is a separate measurement.
Why does my solar monitoring app sometimes update after the weather has changed?
Monitoring platforms may collect, transmit and display readings at different intervals. Some graphs show averaged measurements rather than a live instantaneous value. Check the app’s timestamp, refresh behaviour and whether the data represent a complete installation or a particular inverter before interpreting a sudden change.
Is it better to compare monthly kWh or individual sunny days?
Use both for different purposes. Individual days help investigate weather-related fluctuations, shading patterns and possible faults. Monthly and annual kWh totals are more useful for assessing seasonal performance against location-specific estimates. Comparisons should use matching periods and account for missing monitoring data, installation changes and unusual weather.