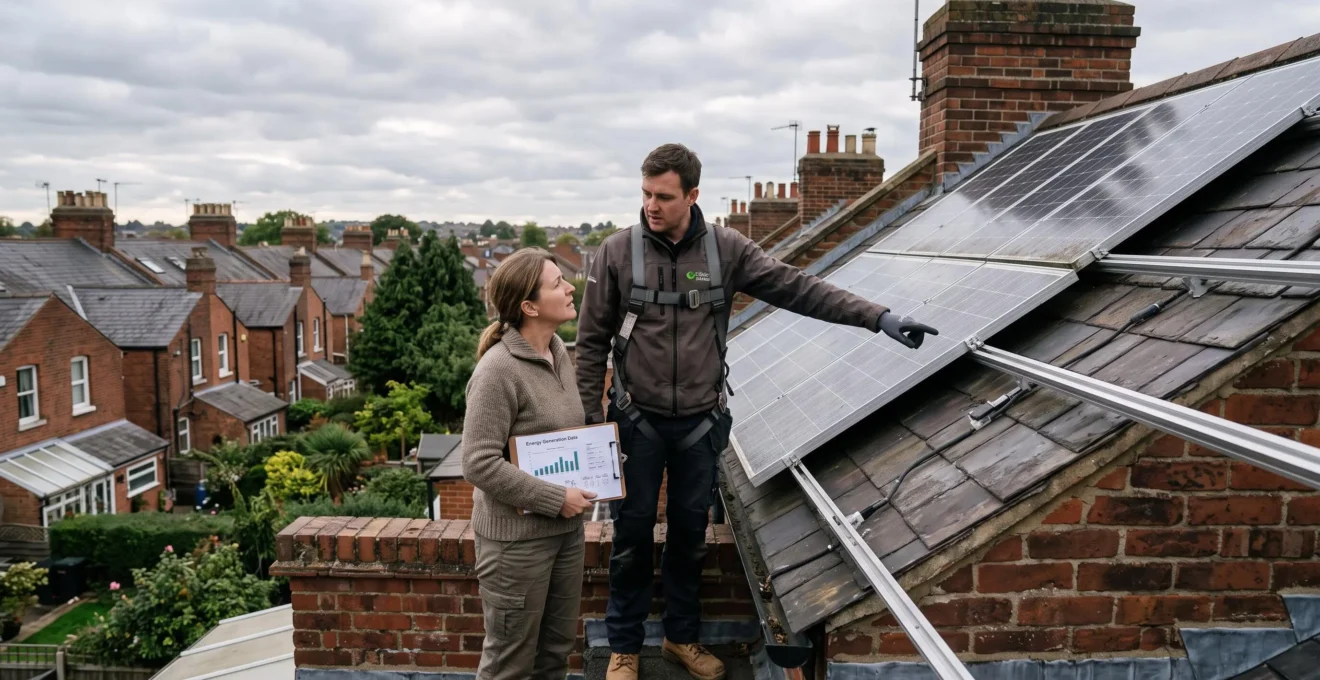
Your solar installer predicted a certain annual electricity yield. Your inverter reports 20% less. Is the British weather responsible, was the original forecast unrealistic, or is something wrong with the installation?
Those explanations require different responses. Poor weather can depress production without indicating a fault. An inaccurate roof-orientation or shading assumption can make an installation appear permanently disappointing. A failed inverter input or electrical fault, however, can genuinely prevent panels from delivering the electricity they should.
A 20% shortfall is a reason to investigate, not proof of equipment failure. The first task is to establish whether you are comparing actual generation with a properly adjusted annual forecast. The second is to determine whether the missing electricity reflects conditions, equipment performance or incorrect monitoring.
Once the system’s real output is understood, household consumption and export readings can reveal whether more panels, battery storage or simple automation would improve the electricity you actually use.
Solar underperformance: the essential checks
- Compare measured electricity generation with the installer’s annual estimate and a location-specific, seasonally adjusted benchmark. A 20% difference is not automatically normal or abnormal.
- Check inverter error messages, daily kWh, monitoring configuration and individual strings where supported before assuming the panels are defective.
- Fix genuine generation losses before investing in more panels or storage. Then use export and consumption data to decide how to make better use of your electricity.
- Why Do Solar Predictions Often Overshoot Real Output in UK Weather?
- How to Check Your PV System for Underperformance Using Inverter Data in 15 Minutes?
- More Panels or a Battery: Which Increases Useful Output More on a Typical UK Day?
- The Monitoring Setup Mistake That Makes Underperformance Invisible for Months
- When Should You Benchmark Solar Output to Spot Problems: Monthly or Seasonal?
- Why Can Two UK Homes 2 Miles Apart Get 2x Different Solar Output?
- How to Shift 3 Key Loads Into Solar Hours Without Changing Your Routine?
- How Do You Use More of Your Own Solar Without Sitting at Home All Day?
Why Do Solar Predictions Often Overshoot Real Output in UK Weather?
Solar forecasts can exceed actual UK electricity production because they represent expected performance under modelled conditions, not guaranteed output. Roof orientation, shading, weather variability and electrical losses all influence the result. However, a properly prepared installer estimate should already account for important site-specific factors, so a persistent 20% gap deserves closer examination.
Solar panel capacity is normally expressed in kilowatt-peak (kWp), measured under standard test conditions. These laboratory conditions establish a common way of rating panels; they do not describe the sunlight and temperatures experienced on a British roof throughout the year.
Importantly, a professional annual yield estimate should not simply multiply the panel’s rated capacity by an assumed number of sunny hours. The cited MCS solar PV installation standard, version 4.0, requires an annual generation estimate and an explanation that the result is guidance rather than a performance guarantee. It also addresses shading-related disclosures. This historical edition should not be treated as the current standard without checking the applicable version.
Consequently, a south-facing, unshaded assumption is not automatically embedded in every installer prediction. The issue is whether the original calculation correctly represents your particular roof.
Several differences matter:
- Orientation and pitch: east- or west-facing arrays distribute generation differently from south-facing installations, while roof inclination affects seasonal exposure.
- Partial shading: chimneys, trees and adjacent buildings may obstruct part of the installation at particular times.
- System losses: cabling, inverter conversion, dirt and equipment condition affect the amount of usable AC electricity delivered.
- Weather and season: cloudy periods and short winter days can produce substantial variations around expected monthly output.
Be careful about comparing different electricity measures. A correctly calculated annual PV generation forecast generally incorporates assumed system losses. It is not necessarily a gross DC figure. Likewise, solar electricity consumed immediately at home is still generated electricity, even though it never appears on an export meter.
The distinction matters when the quoted prediction looks optimistic. The European Commission PVGIS grid-connected solar calculations provide location-specific monthly and annual estimates using inputs including system capacity, orientation, inclination and losses. They also describe year-to-year variability in monthly generation.
For a comparison that is meaningful, calculate your measured annual specific yield:
Specific yield (kWh/kWp) = annual electricity generated (kWh) ÷ installed PV capacity (kWp).
For example, in a hypothetical installation, a 4 kWp array generating 3,200 kWh annually has a specific yield of 800 kWh/kWp. That figure becomes useful when compared with a model configured for the same location and roof rather than with an unrelated national average.
There is no evidence in the supplied technical references for a universal percentage that separates normal variance from a fault. A single dull month may be unremarkable; a persistent annual shortfall against a properly specified estimate is a stronger signal.
Once those assumptions are documented, the next question is whether your inverter confirms that every part of the system is actually producing.
How to Check Your PV System for Underperformance Using Inverter Data in 15 Minutes?
You can perform an initial solar performance check in around 15 minutes by reviewing inverter status, reading generation totals, calculating output per installed kWp and checking for unexplained differences between strings. This will not replace professional electrical testing, but it can distinguish an obvious shutdown from a possible ongoing performance problem.
Start with the inverter display or monitoring application. Find the current operating status, daily electricity generation in kWh and monthly or annual generation history. Confirm that these readings represent electricity produced rather than electricity exported or consumed.
If the inverter is reporting normally, divide the generation figure for your chosen period by the installed array capacity. For example, a hypothetical 4 kWp installation producing 12 kWh in one day delivers 3 kWh/kWp for that day.
Do not diagnose underperformance from that number alone. The relevant comparison is the expected production for the same place, roof configuration, period and weather conditions.
Where your monitoring system exposes individual string or MPPT input data, inspect those readings too. A substantial difference between genuinely comparable strings under similar sunlight conditions may indicate shading, disconnection or another equipment problem. Differences are not necessarily faults if the strings face different directions, have different panel counts or operate under separate conditions.
Classify what you find before taking action:
| Observed symptom | Possible explanation | Appropriate response |
|---|---|---|
| No generation during daylight | Inverter fault, shutdown, electrical protection issue or monitoring failure | Record the error and contact the installer if the cause is not clear |
| Lower-than-expected generation | Weather, shade, soiling, equipment losses or incorrect assumptions | Compare with a seasonally adjusted benchmark |
| One string substantially below a comparable string | String-specific shade, wiring or module issue | Request professional investigation if persistent |
| Normal inverter totals but odd app figures | Configuration, communications or metering inconsistency | Audit the monitoring data before blaming generation |
Never open the inverter casing, disconnect DC connectors or interfere with protective electrical devices to investigate. PV DC circuits can remain live in daylight. An error code, unexpected protection trip or suspected wiring problem belongs with a competent installer or electrician.
Your five-step solar performance evidence check
- Record the system details. Save the installed capacity in kWp and a photograph or copy of the original annual generation estimate.
- Capture inverter status. Save a screenshot showing operating state, any error code and the date or time of the reading.
- Calculate specific yield. Write down generation for a complete period and divide its kWh total by installed kWp.
- Check available input data. Export or photograph string-level readings, noting whether the strings are genuinely comparable.
- Document the discrepancy. Prepare a short record containing actual yield, seasonally relevant expectation and any persistent alerts to share with the installer.
If measured generation is genuinely deficient, repairing the cause may recover useful electricity without any new equipment. If generation is healthy, attention can shift towards storage and additional capacity.
More Panels or a Battery: Which Increases Useful Output More on a Typical UK Day?
Additional solar panels increase the electricity your installation can generate, whereas a battery stores some of the electricity already available for use later. Panels are more relevant when generation capacity is insufficient; a battery becomes relevant when significant daytime exports coincide with evening electricity purchases. Neither option is automatically superior without examining household demand.
First separate three measurements: electricity generated by the array, electricity used immediately in the home and electricity exported to the grid.
If a property generates plenty of solar electricity at lunchtime but imports electricity after sunset, the problem may be timing rather than generation. Storage can shift some of that existing production into the evening, subject to battery capacity and conversion losses.
If the panels themselves generate relatively little because of limited installed capacity, adding modules may increase potential output. However, expanding a system whose inverter settings, shading assumptions or connections are already problematic risks spending money without resolving the original complaint.
The Energy Saving Trust advice on battery storage explains that domestic batteries can store excess solar electricity and can also charge from the grid under suitable time-of-use tariffs. Battery capacity should reflect household requirements rather than a generic recommendation.
Consider this decision grid:
| Household evidence | More panels | Battery storage |
|---|---|---|
| Low generation relative to realistic roof potential | Investigate after ruling out existing faults | Does not fix low generation |
| Frequent midday exports and evening imports | May create additional exports | Can shift available solar to evening use |
| Little daytime surplus | May create more generation where suitable | Solar charging opportunities may be limited |
| Faulty string or incorrectly configured inverter | Not the first remedy | Not the first remedy |
| Attractive export payments relative to avoided import costs | Economics depend on generation and export terms | Potential savings require careful tariff calculations |
A battery should be assessed against the energy the household actually uses after sunset, the surplus available for charging, storage losses and the applicable tariffs. A larger battery does not necessarily deliver greater financial benefit, particularly if insufficient surplus generation is available to charge it regularly.
Battery settings also matter. Some systems charge from lower-priced grid electricity, which can be a deliberate tariff strategy. Consequently, a high battery utilisation figure does not establish that additional solar electricity has been self-consumed.
Export has a financial value too. Ofgem‘s Smart Export Guarantee information for generators explains the arrangements for eligible exported electricity in Great Britain. Payments depend on measured exports and the selected supplier’s contractual terms. This scheme should not be assumed to apply identically across the entire UK.
To judge storage economics, compare the value of avoided grid purchases with the export revenue forgone, battery losses, equipment costs and tariff conditions. Exported electricity is not necessarily wasted electricity.
There is also a third option: repair the existing system. Correcting a genuine performance defect may improve generation more directly than buying a battery or adding panels.
That decision depends on accurate readings, which makes the reliability of the monitoring setup the next part of the investigation.
The Monitoring Setup Mistake That Makes Underperformance Invisible for Months
The most consequential monitoring mistake is treating an inverter’s online or healthy status as evidence that its energy production is satisfactory. Connectivity confirms that information is being reported; it does not prove that the installation is achieving its expected yield. Without generation benchmarks or suitable alerts, sustained losses can remain unnoticed.
A monitoring dashboard may display an uninterrupted sequence of daily graphs even when production is consistently below a realistic expectation. The graph establishes that something was recorded, not that every panel or input is functioning optimally.
Monitoring problems can also introduce misleading numbers. Examples worth investigating include:
- An application configured with an incorrect installed kWp capacity, distorting its calculated specific yield.
- Estimated or reconstructed data displayed alongside actual meter readings without a clear distinction.
- Incomplete reporting from one inverter in a multi-inverter installation.
- Missing or incorrectly configured current sensors that distort consumption and export estimates.
- Alerts disabled or set only to detect communication failures rather than production anomalies.
Do not assume that a generation meter, an inverter display and a smart meter necessarily measure the same quantity. A generation meter records generated electricity at its designated measurement point, while an import/export meter records electricity crossing the grid connection boundary.
That means the inverter’s total generation should not normally be expected to match export readings. Electricity used directly by household appliances accounts for much of the difference, while metering locations, hybrid systems and conversion losses introduce further complications.
A useful monitoring audit starts by checking the system diagram or installer documentation. Identify which device measures solar generation, which measures household load and which measures electricity exported to the grid.
Then select a complete common measurement period. Compare inverter generation with any independent generation meter covering the same equipment and period. Separately compare recorded exports with available supplier or smart-meter export data.
Where the necessary measurements exist and the system configuration supports the calculation, a simplified household energy balance can help:
Direct solar self-consumption ≈ solar generation − solar exports.
This relationship needs adjustment or more detailed metering where batteries, multiple generation sources, grid charging or different measurement boundaries are involved.
If the figures disagree unexpectedly, establish what each sensor actually measures before concluding that panels are missing output.
Finally, review notification settings. Where supported, enable inverter fault alerts and meaningful production-deviation warnings. An alert for zero generation must account for nighttime and expected daylight conditions to avoid false alarms.
Once monitoring is trustworthy, the strongest way to distinguish weather variation from ongoing losses is to benchmark output over meaningful periods.
When Should You Benchmark Solar Output to Spot Problems: Monthly or Seasonal?
Use monthly checks to detect sudden faults, but rely on seasonal and like-for-like comparisons to evaluate long-term solar performance. UK generation changes substantially through the year, so comparing December directly with June is not a useful test. Comparing the same month across different years, with weather differences considered, is more informative.
A solar array follows a seasonal production pattern because daylight duration, solar angle and weather change throughout the year. A winter reduction is therefore expected even when the installation operates correctly.
To build a useful personal benchmark, record the following every month:
- Total generated electricity in kWh.
- Specific yield in kWh/kWp.
- Any inverter faults, outages or maintenance events.
- Notable shading changes or unusual weather conditions.
- Any changes to monitoring, panel configuration or inverter settings.
During the first complete year, those records establish an initial 12-month history. From the second year, compare January with January, February with February and so on. This reduces the obvious seasonal mismatch, although different weather conditions can still explain meaningful differences.
A location-specific PV modelling tool can provide an independent expected monthly profile. Regional sunshine information can also help interpret exceptionally bright or dull periods. Neither approach should be treated as a guarantee of exact generation.
For example, imagine a hypothetical system producing 240 kWh in one March and 200 kWh the next. That is a reduction of approximately 17%.
It would be premature to label this an equipment fault without checking differences in weather, shading and operating history. By contrast, an abrupt decline accompanied by an inverter error or a persistently inactive input deserves more immediate attention.
Monthly monitoring and seasonal benchmarking serve different purposes. Monthly checks are an early-warning mechanism; seasonal comparison helps evaluate whether the system continues to perform plausibly over time.
There is also a limit to what owner-operated monitoring can establish. A persistent unexplained deficit may require professional electrical measurements, inspection of strings and connectors, or thermal investigation where appropriate. These procedures can reveal faults that household generation totals cannot identify.
Before using another household’s figures as supporting evidence, however, consider how much two nearby roofs can differ physically.
Why Can Two UK Homes 2 Miles Apart Get 2x Different Solar Output?
Two homes only two miles apart can report very different solar generation because their systems may have different installed capacities, orientations, shading exposure and equipment configurations. A twofold difference is possible under sufficiently different conditions, but distance alone does not explain it. Comparing raw kWh without accounting for those factors is misleading.
Imagine two hypothetical neighbouring properties. Home A has a 5 kWp system on a largely unobstructed roof, while Home B has a 3 kWp system distributed across roof sections with afternoon shading.
If Home A produces twice as many kWh over a chosen period, that difference does not prove Home B is defective. The installed-capacity difference already affects total generation, and the roofs receive usable sunlight under different conditions.
The important factors are:
- System size: a larger array can produce more total energy without being more efficient per installed kWp.
- Roof direction: south-, east- and west-facing panels have different daily generation profiles.
- Inclination: panel angle changes the distribution of solar exposure throughout the year.
- Local shading: chimney stacks, trees and nearby buildings may obstruct specific modules.
- Electrical design: inverter configuration, string grouping and module-level electronics affect how panel differences influence output.
- Local weather: passing cloud and site-specific exposure can cause short-term differences, even at nearby properties.
Shading effects deserve particular care. In a conventional series-connected string, reduced current from a shaded module can affect the behaviour of other modules. Bypass diodes and the system’s electrical architecture change the result, so one shaded panel does not necessarily reduce an entire string by a fixed percentage.
A meaningful comparison begins by converting both households’ generation to kWh/kWp for the same period. Next, account for orientation, inclination and shading differences using suitable site-specific estimates.
If both installations have similar expected specific yields after those adjustments but one repeatedly produces substantially less, the comparison becomes more useful as diagnostic evidence.
This is also how a supposedly missing 20% can be reframed. Some of the apparent gap may arise from the installation’s real roof characteristics not being accurately represented in the original estimate. But that explanation must be demonstrated, not assumed.
After establishing what your own roof should realistically generate, the next opportunity is to use more of that electricity without changing where you spend your day.
How to Shift 3 Key Loads Into Solar Hours Without Changing Your Routine?
You can shift three useful categories of household demand into solar-generating hours using appliance delay timers, suitable hot-water controls and scheduled electric vehicle charging. The objective is to consume electricity that your panels would otherwise export, without requiring anyone to remain at home or manually switch appliances on when sunlight increases.
Start by identifying when your inverter reports generation above the household’s normal daytime demand. This period may concentrate around midday, but the actual window depends on roof orientation, season, weather and occupancy.
A standard timer is a prediction-based tool: it starts an appliance at a chosen time whether or not solar generation is sufficient. A controller using live generation or export measurements can respond more directly to surplus electricity.
The three practical categories are:
- Washing machines and dishwashers. Where the appliance supports delayed starts, schedule an existing wash cycle within a period of commonly higher generation. Use an appropriate programme and follow the manufacturer’s safety guidance for unattended operation.
- Domestic hot water. Where an immersion heater and compatible system are installed, a professionally fitted solar diverter can route suitable surplus power towards water heating. The benefit depends on the household’s existing water-heating costs and controls.
- Electric vehicle charging. A compatible charger may support scheduled charging or solar-surplus tracking. The available solar power, minimum charger operating requirements and the vehicle’s required departure charge all affect the result.
Portable heating or cooling can sometimes be moved into daytime hours, but running additional equipment solely because solar electricity is available is not automatically economical or energy-efficient.
Suppose your generation history shows a regular period of surplus during late morning. Shifting an existing dishwasher cycle into that period might reduce imported electricity. But if the weather changes and solar production falls, the appliance may still import electricity while running.
That is why the timer’s performance should be measured, not presumed.
Check comparable days before and after a scheduling change. Look for lower imports during the appliance’s operating period and a corresponding change in exports. If consumption has increased because extra cycles are being run, the intended benefit may disappear.
Smart plugs are not suitable for every high-power appliance. Use only controls rated and approved for the connected equipment, and leave immersion heater wiring, fixed electrical controls and EV charger installation to appropriately qualified professionals.
The aim is not to maximise daytime demand. It is to move an existing, necessary demand to a period when home-produced electricity can meet more of it.
Once these simple schedules are operating, measure whether they genuinely improve the share of generated electricity consumed at home before considering more expensive measures.
Key takeaways before optimising self-consumption
- Verify actual generation and resolve significant unexplained losses before buying equipment intended to improve energy use.
- Choose automation based on measured surplus periods, appliance requirements and the household’s existing electricity demand.
- Judge changes using both import and export data, not just higher daytime consumption or an attractive monitoring graph.
How Do You Use More of Your Own Solar Without Sitting at Home All Day?
Increasing solar self-consumption does not require being at home during peak generation. Automated appliance schedules, hot-water diversion, suitable EV charging controls and battery storage can align household electricity use with production. The best solution depends on when you consume electricity, how much you export and whether the installation is already generating as expected.
For many households, the underlying issue is a timing mismatch. Solar generation often peaks during daylight hours, while substantial domestic demand occurs early in the morning or in the evening.
Automation addresses flexible daytime loads without changing daily routines. Battery storage offers a different approach by moving some of the available electricity into later periods. Smart tariffs can also affect the optimal strategy, since importing electricity at one time and exporting it at another may have different financial consequences.
Consider the options in a practical sequence:
| Approach | Best suited to | Main limitation |
|---|---|---|
| Appliance delay timers | Households with flexible existing wash cycles | Fixed schedules cannot predict changing cloud cover |
| Hot-water diversion | Homes with suitable immersion heating and available surplus | Value depends on alternative water-heating costs |
| Solar-aware EV charging | EV owners with daytime vehicle availability | Charging requirements and vehicle availability constrain flexibility |
| Home battery | Homes with surplus generation and later demand | Purchase cost, losses, capacity and tariffs affect returns |
| Tariff-based scheduling | Households able to respond to different import and export rates | Best financial outcome may not mean maximum solar self-consumption |
To measure improvement, calculate the proportion of generated solar electricity consumed within the home rather than exported. In a simple PV-only installation with appropriately matched generation and export measurements:
Solar self-consumption ratio = (solar generation − solar exports) ÷ solar generation × 100%.
For a hypothetical example, if a system generates 100 kWh and exports 40 kWh during a period, 60 kWh is retained for household use, giving a 60% self-consumption ratio. This simplified calculation assumes no complicating battery flows, other generation sources or incompatible meter boundaries.
Now suppose an automation change reduces exports while total generation and household demand remain comparable. That provides evidence that more existing solar electricity is being used locally. But if a battery is installed, its charging source, discharge destination and losses require a more complete energy balance.
A higher self-consumption ratio is not always the same as a lower bill. Export payments, import tariffs, equipment expenditure and conversion losses can change the economic result.
Most importantly, greater self-consumption cannot repair an underperforming PV array. A household can consume nearly all its generated electricity and still be missing substantial output because of a system fault.
Your next step is to export a complete period of inverter generation, import and export readings, compare the production against the properly configured benchmark, and investigate any unexplained deficit. Only then assess which automation or storage option offers a measurable improvement.
Can an installer guarantee the annual electricity production shown on my solar quote?
A generation estimate is not automatically a performance guarantee. The cited MCS installation standard explains that annual production estimates are guidance rather than guaranteed output. Review the signed quotation, applicable contract terms and original system design to establish what the installer specifically committed to.
Does a 20% shortfall mean my solar panels are defective?
No. The difference may reflect weather, modelling assumptions, site shading, measurement errors or actual equipment underperformance. Compare a complete measured period against a location-specific estimate that accurately represents the installation. If the discrepancy persists without a satisfactory explanation, request a professional assessment.
Why doesn’t my smart meter export reading match my inverter’s solar generation?
An inverter generally reports electricity generated by the PV system, while an export meter records electricity sent to the grid. Electricity consumed directly by the household is not exported. Batteries, other generators and differences in measurement locations can make the relationship more complicated.
Should I clean the panels myself if their output has dropped?
Do not assume that dirt is the cause or attempt unsafe roof access. First compare generation with seasonal expectations and inspect available monitoring information. If significant soiling or damage is suspected, ask a competent service provider to assess whether cleaning or maintenance is necessary and how it can be completed safely.
What evidence should I send the installer when reporting poor solar output?
Provide the original annual forecast, installed system capacity, dated inverter generation records, relevant error codes, photographs of monitoring displays and a comparison with an appropriately configured seasonal benchmark. Note any changes in shading or equipment configuration. These records help the installer decide whether further electrical testing is justified.